
By Gavin Klose
Feedsy (Co-founder)
It is fair to say that 2020 was not like any ordinary year and whilst many in Australia have almost returned to life as normal, our lives will be probably changed for ever.
But did COVID change the way we communicate through email (and what is “Normal” email engagement)?
There have been studies that have found that people did indeed turn to email for information, education and inspiration during the 2020 pandemic.
One study by Validity, Disruption – how the 2020 pandemic changed email, found that emails peaked by 12.5% above average at the zenith of the COVID outbreak in April 2020.
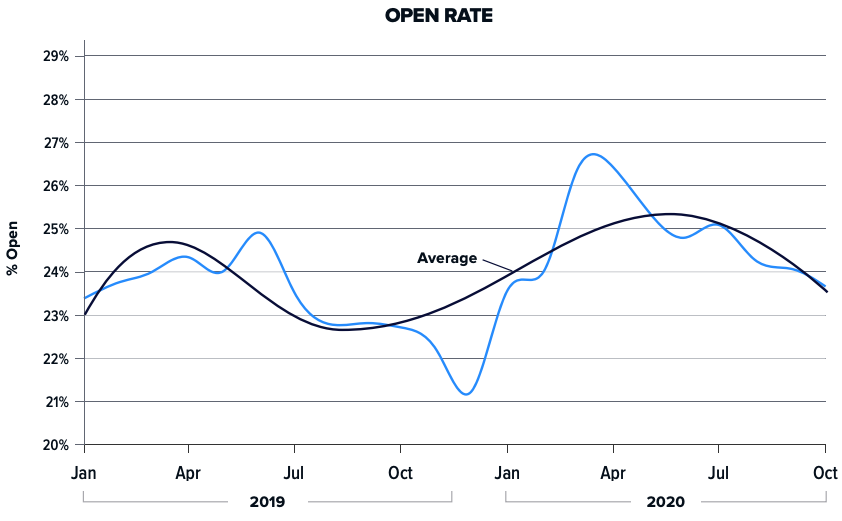
Source: Disruption – how the 2020 pandemic changed email
As Australians shifted from the office to working from home, so did the number of emails received increase from co-workers and marketers.
And the initial flood of these emails were opened and clicked as people turned to this channel as a trusted source of information and connection.
We found a similar trend for our community’s Feedsy newsletters (FeedsyMails) with a 12% increase in opens during March-May 2020.
However, email engagement has now returned to normal (and has avoided “fatigue” from over-saturation) since the peak at the beginning of the pandemic.
Validity observed “This may reflect increased use and consumption of digital communication channels as people worked from or remained at home early in the pandemic, and an increased reliance on email. However, open rates have largely returned to pre-pandemic levels.” and our data reveals a similar story.
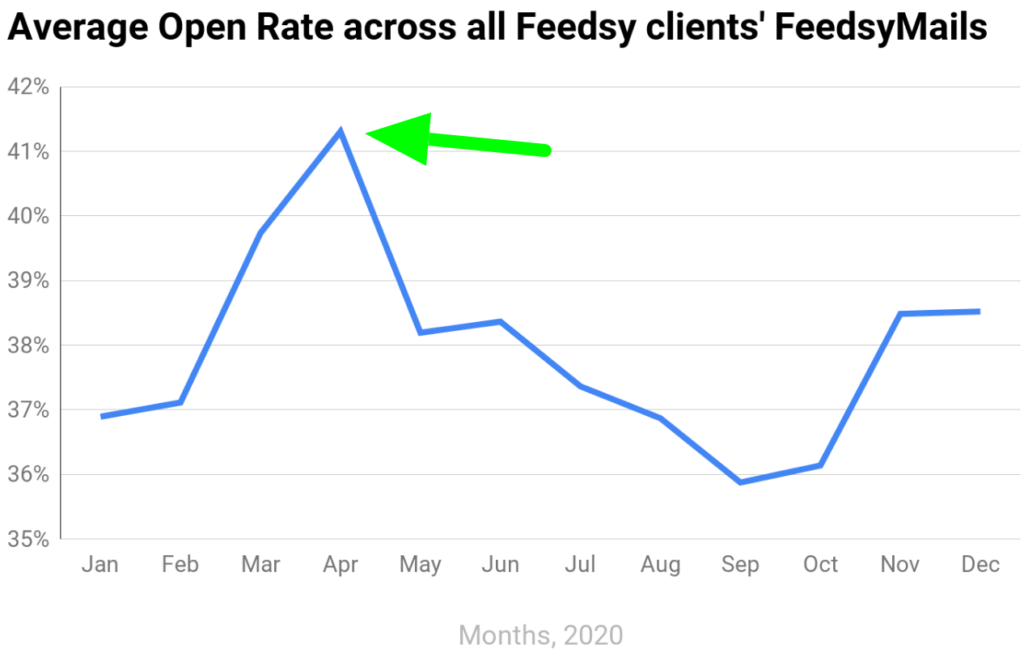
Source: Feedsy aggregate data January-December 2020
What is the new “normal”?
Firstly, how do you measure email engagement?
The two main KPIs are:
- Open rate – is the percentage of emails opened of the total received.
So 10% would mean that 10% of people who receive an email opened it to have a look. - Click-to-open rate – is of the percentage of the number of articles/links clicked on per opened email.
So 2% would mean that 2% of subscribers who opened an email then clicked-on articles/links to find out more.
Here are KPI benchmarks from a recent report by Campaign Monitor, Email Marketing Benchmarks, which analysed over 100 billion emails worldwide between January and Decemeber 2020.
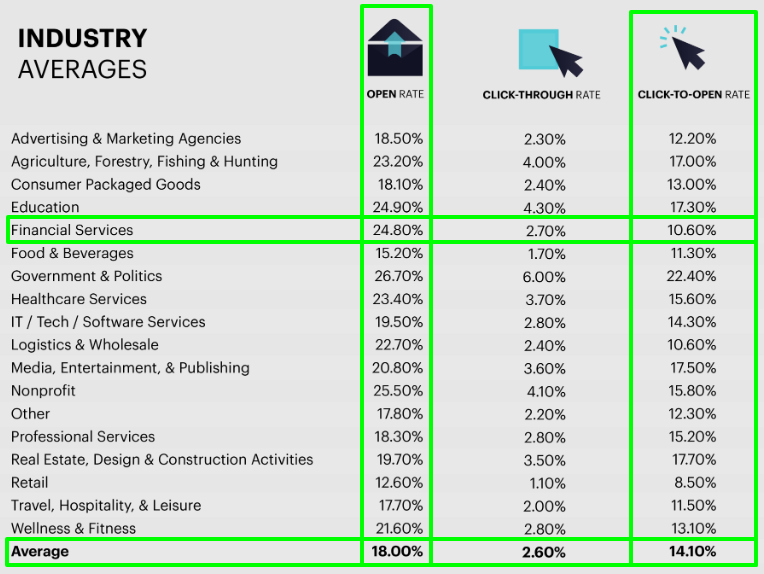
Source: Feedsy data and Email Marketing Benchmarks
Average (all industries)
- Open rate: 18.0%
- Click-to-open rate: 14.1%
Financial services
- Open rate: 24.8%
- Click-to-open rate: 10.6%
We are very please to report that from the aggregated data of all Feedsy clients’ FeedsyMail sends from January to December 2020, we have again exceeded industry benchmarks
Feedsy newsletters
- Open rate: 37.9% (111% higher than average and 53% higher than the Financial services)
- Click-to-open rate: 21.7% (54% higher than average and 105% higher than the Financial services)
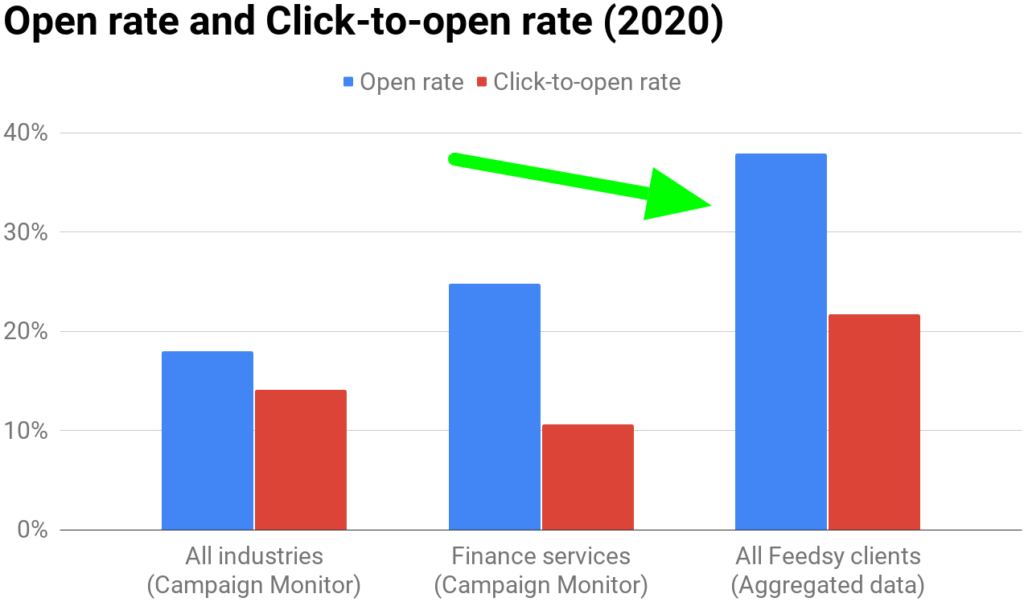
Source: Feedsy data and Email Marketing Benchmarks, Campaign Monitor
If you would like to discuss your own email engagement metrics and practices to nurture and grow your client base then I’d welcome a chat.