Global share markets fell over the last week on the back of concerns about more central bank rate hikes, ongoing upwards pressure on bond yields and worries about poor growth and property problems in China. For the week US shares fell 2.1%, Eurozone shares fell 2.4%, Japanese shares fell 3.2% and Chinese shares lost 2.6%. Reflecting the weak global lead Australian shares fell 2.6% despite dovish wages and jobs data with falls led by materials, financials, telcos, industrials and retail stocks. Bond yields continued to rise. Oil prices fell back a bit but remain well up from June lows on the back of supply cutbacks. Metal prices fell but the iron ore price rose. The $A fell further as the $US rose, as RBA interest rate expectations fell relative to those in the US and as worries about the Chinese economy intensified.
Shares look to be entering a correction. For some time, we have been concerned about the risk of a correction for shares given strong gains for the direction setting US share market into July which left it technically vulnerable as we came into the seasonally weak August to October period. From their July highs US and Australian shares have pulled back by around 4-5% but markets remain at risk of further falls given: the still high risks of recession; intensifying risks around the Chinese economy; a pause in disinflation in response to higher energy prices and sticky services inflation; central banks still at risk of more hikes; the high risk of another US Government shutdown from 1 October; and rising bond yields. We would regard further falls as part of a correction though and we retain a positive 12-month view on shares as inflation is likely to continue to trend down taking pressure off central banks and any recession is likely to be mild.
The past week provided a reminder that while inflation looks to have passed its peak and central banks may be at or close to the top its not necessarily smooth sailing yet. In particular,
- The minutes from the Fed’s last meeting had a somewhat hawkish tone leaving the door open to more rate hikes on the back of “significant upside risks” to inflation and a “very tight” labour market. With stronger data recently the minutes indicated that the risk to US rates is still on the upside.
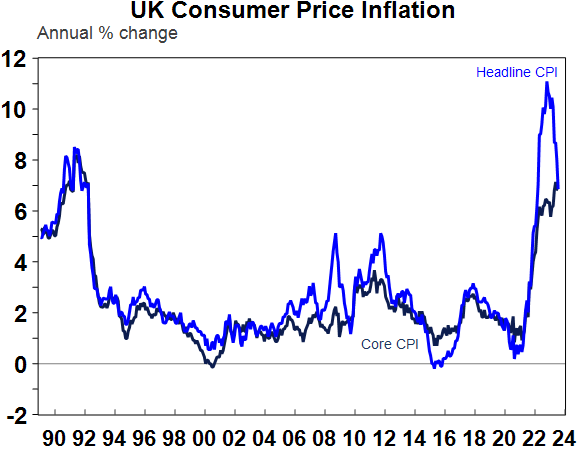
- UK inflation (at 6.8%yoy) and wages growth (at 7.8%yoy) came in stronger than expected keeping the BoE on track for another 0.5% hike at its next meeting. The read through to other countries including the US and Australia is minimal though given the UK’s much higher inflation and wages growth.
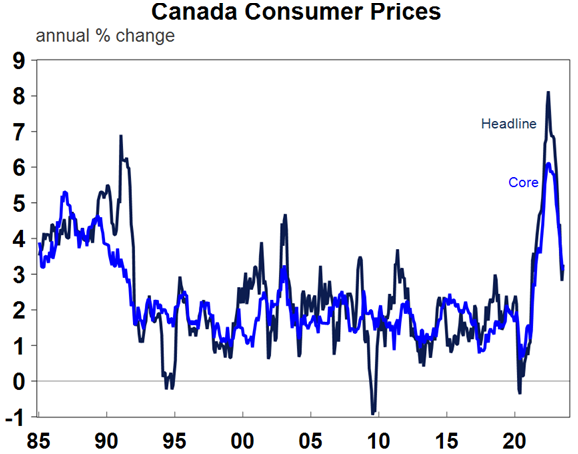
- Canadian inflation also came in stronger than expected in July keeping alive the possibility of another BoC rate hike.
- The RBNZ left rates on hold but pushed out its projection for the start of rate cuts.
This all warns that the path to lower rates is not necessarily smooth and adds to share markets’ vulnerability to a correction.
Australia is a little bit different though reflecting the greater vulnerability of Australian households to higher interest rates. The minutes from the RBA’s last meeting reiterated its softened tightening bias but saw the risks to its forecasts as balanced and jobs and wages data in the last week were softer than expected. Of course, wages growth will rise this quarter as this year’s higher award and minimum wage rises flow through which will add 0.3% to wages growth taking it to 4% or just above. However, this should be in line with our own and RBA expectations. And for now the combination of softer than expected wages growth and ongoing evidence of a cooling in the jobs market are consistent with the RBA leaving interest rates on hold at its September meeting. Of course, data for retail sales and inflation ahead of the next meeting could still influence things.
So what’s driving the renewed rise in bond yields. From their lows in April, 10-year bond yields have increased around 100 basis points pushing US yields to their highest since 2007 and Australian yields to their highest since 2014. The main driver has been stronger than expected economic data fuelling expectations of higher for longer central bank interest rates. But also acting to push up bond yields are increasing concerns about high budget deficit and public debt levels in the US following Fitch’s downgrade to the US’ credit rating, the return of US Treasury issuance following the resolution of the debt ceiling and the Bank of Japan’s loosening of its cap on its 10-year bond yields. Australian bond yields have just been dragged up with US yields, but this is hard to justify given domestic developments with smaller public debt and more vulnerable households. If global growth slows as we expect then it will help to put a lid on bond yields but that may take time. In the meantime, the rebound in bond yields is putting renewed pressure on share markets as higher bond yields make shares look less attractive to investors. It also risks higher fixed mortgage rates which is another drag for the residential property market, and it will intensify the hit to commercial property values. The combination of rising bond yields and renewed strength in the $US has also contributed to a 17% plunge in Bitcoin from its July high.
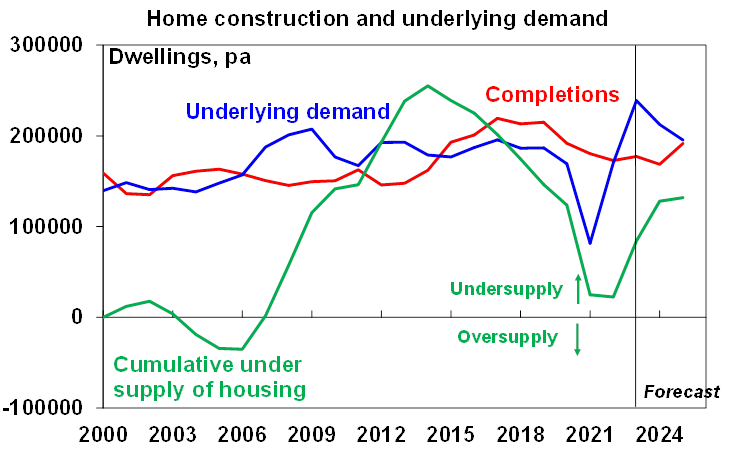
Australian governments to target 1.2 million new homes over five years from July 2024 – or 240,000 each year. The deal struck with the states is a step up from the prior target to build 1 million homes over five years – which was nothing more than what had been delivered in the last five years – and is backed by an extra $3bn in funding for states contingent upon boosting supply by more than their per capita share in well located areas, $500m for states and local government for amenities and services to support new housing supply in well located areas and a national planning reform regarding planning, zoning, land release and other measures. It is reminiscent of a Federal/state deal to boost housing supply back in 2008, but this deal is much bigger. Focusing on boosting supply rather than providing grants for demand is the key. Underlying demographic demand is currently running around 215,000 dwellings per annum but we already have a shortfall of at least 100,000 dwellings (depending on what is assumed regarding average household size). So, we need to build more than underlying demand each year to bring down the shortfall. Hence targeting 240,000 pa makes sense. That said, delivering on this will be a challenge as over the last five years we have only managed to supply 1 million new homes, material constraints and skill shortages have arguably increased and commencements have already slumped to around 175,000pa. Focusing the extra construction on presumably lower cost social and affordable housing would make the task a bit easier though. More should be done to better calibrate immigration to housing supply potential and make it easier to relocate from expensive city housing. But at least it’s a decent move in the right direction.
Source: Bloomberg, AMP
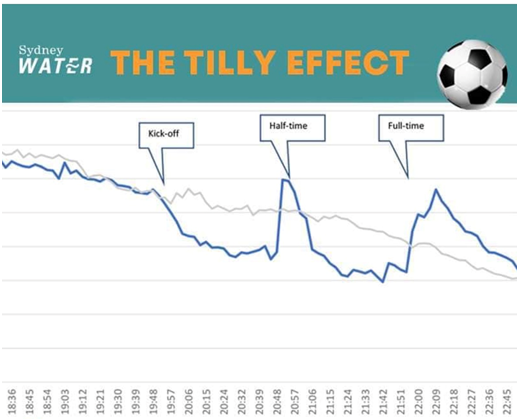
With the Matilda’s success has come much debate in the last week about their economic effect including around a potential public holiday (I think the PM spoke too soon on that one!). If you haven’t already seen it here’s the impact on water usage in Sydney from Sydney Water during the match with England on Wednesday night. Of course, it all reverted to trend in the end.
Source: Sydney Water
Economic activity trackers
Our Economic Activity Trackers are still not providing any decisive indication of recession (or a growth rebound).
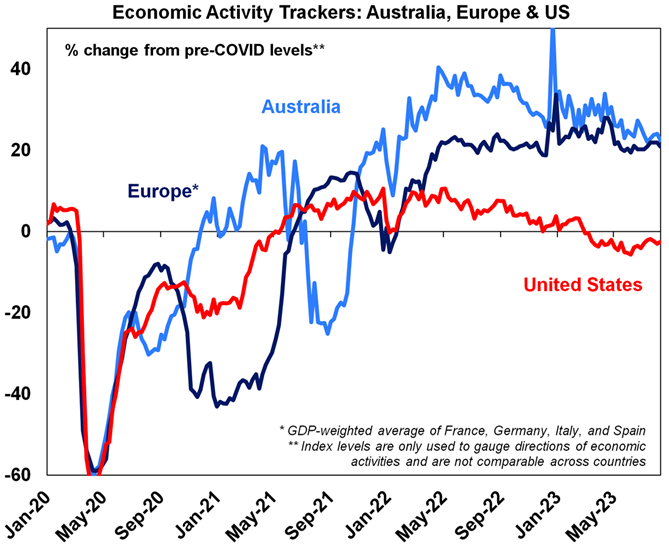
Levels are not really comparable across countries. Based on weekly data for eg job ads, restaurant bookings, confidence, credit & debit card transactions and hotel bookings. Source: AMP
Major global economic events and implications
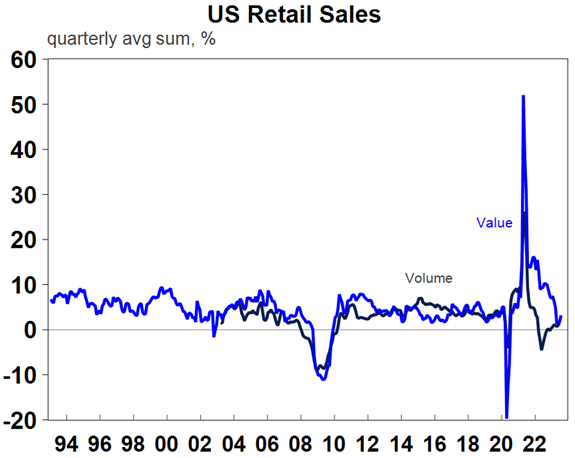
US economic data was mixed in the last week. Retail sales and industrial production were both far stronger than expected adding to concern that the US economy might be too strong, although both may have been impacted by seasonal distortions. Housing starts also rose more than expected in July. Against this the NAHB home builders’ conditions index fell and mortgage applications remain very weak reflecting the renewed rise in mortgage rates which points to renewed weakness in housing indicators. Manufacturing conditions were also mixed – down in the New York region but up in the Philadelphia region. Initial jobless claims fell but continuing claims rose and the US leading index continues to point to a high risk of recession.
Source: Macrobond, AMP
Canadian inflation rose more than expected in July. CPI inflation rose to 3.3%yoy from 2.8%, but core (ex food and energy) inflation was unchanged at a downwardly revised 3.7%yoy and the trimmed mean fell slightly to 3.6%. The BoC is likely to remain on hold in September, but the risk of another rate hike remains high.
Source: Macrobond, AMP
Inflation in the UK is more problematic though. It fell in July but by less than expected to 6.8%yoy for the CPI and core inflation was stronger than expected at 6.9%. While there are signs that the UK jobs market is cooling with unemployment rising to 4.2%, a further acceleration in wages growth to 7.8%yoy and sticky services inflation likely leaves the Bank of England on track for a 0.5% rate hike in September.
Source: Macrobond, AMP
Japanese economic growth came in better than expected at 1.5%qoq or 2%yoy in the June quarter. Consumer spending and investment were weak but a strong contribution from trade kept growth solid. Meanwhile, inflation in July remained at 3.3%yoy but core (ex food & energy) inflation rose to 2.7%yoy from 2.6%.
The Reserve Bank of New Zealand left interest rates on hold at 5.5% as expected but sounded a little bit more hawkish. Guidance remained for the cash rate “to stay at restrictive levels for the foreseeable future” but it revised up the cash rate path to a peak of 5.59% with slower cuts from 2nd half next year, on the back of slightly higher inflation forecasts.
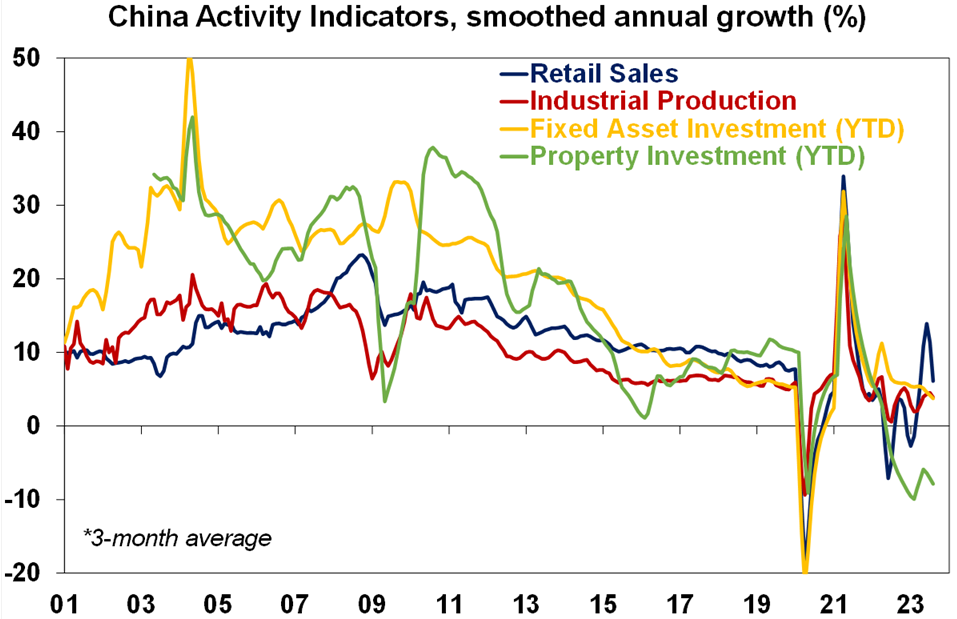
Concerns about China continue to mount. Data for July showed that growth in industrial production, retail sales and investment slowed further, property sales and investment were very weak and property prices continued to fall with the latter adding to pressure on property developers. Unemployment rose to 5.3% and youth unemployment which was already at 21% would have likely increased further as well, although the NBS has stopped publishing the data pending a review. This comes on the back of data showing weak trade and credit data and very low inflation. Looking forward improved weather may help but the weakness is likely to persist in the absence of more decisive stimulus measures with problems around Chinese property market developers and related investment funds intensifying again. The PBOC cut key interest rates but it was only by 0.1 and 0.15% so is unlikely to make much of a difference particularly given little desire to borrow. More policy stimulus measures are likely so it would be wrong to get too negative on China, but with the Government seemingly worried about adding to debt it risks remaining too constrained.
Source: Bloomberg, AMP
Australian economic events and implications
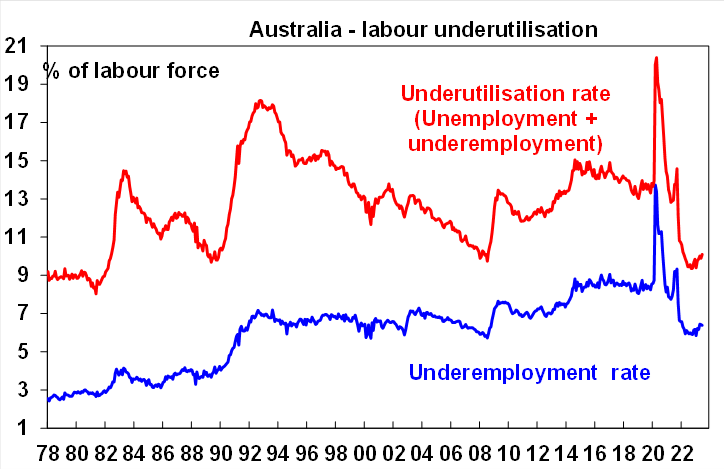
The Australian jobs market is softening. Employment unexpectedly fell by nearly 15,000 in July and unemployment rose back to 3.7%. The ABS notes that seasonal distortions around school holidays may have contributed to the fall in employment and its clear that the jobs market is still tight with still low unemployment. However, its gradually cooling with jobs growth slowing down, unemployment up from its low of 3.4% last October and underemployment up from a low in February of 5.8% (to 6.4% now), resulting in a gradual rising trend in labour underutilisation.
Source: ABS, AMP
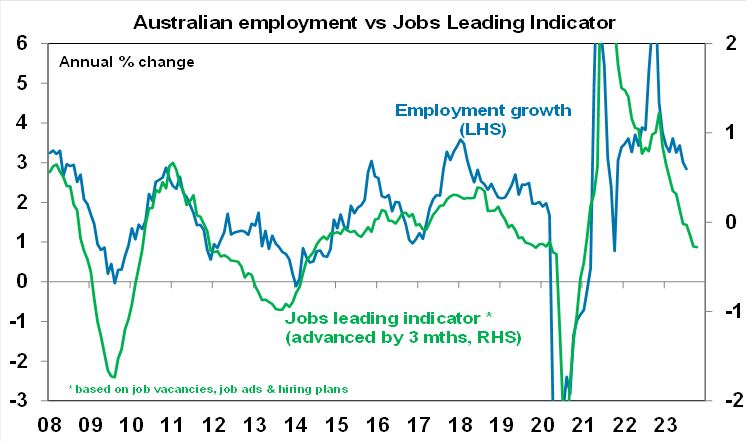
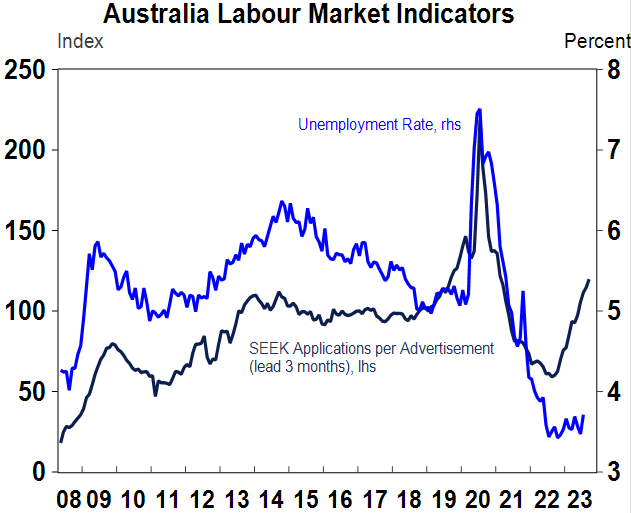
Leading indicators of jobs growth point to a further slowing ahead. Our Jobs Leading Indicator based on job vacancies and hiring plans points to a sharp slowing in jobs growth to around 1%yoy (or 12,000 net new jobs a month) (first chart) and data from Seek shows a rising trend in applications per job ad (second chart) which points to rising unemployment as do consumer surveys showing a rising trend in unemployment expectations. With the surge in immigration driving strong population and hence workforce growth, around 35,000 net new jobs a month are required to stop unemployment from rising. Anything below this (absent a fall in participation) will see higher unemployment. We expect unemployment to rise to around 4.5% by mid next year.
Source: ABS, AMP
Source: Macrobond, Seek, ABS, AMP
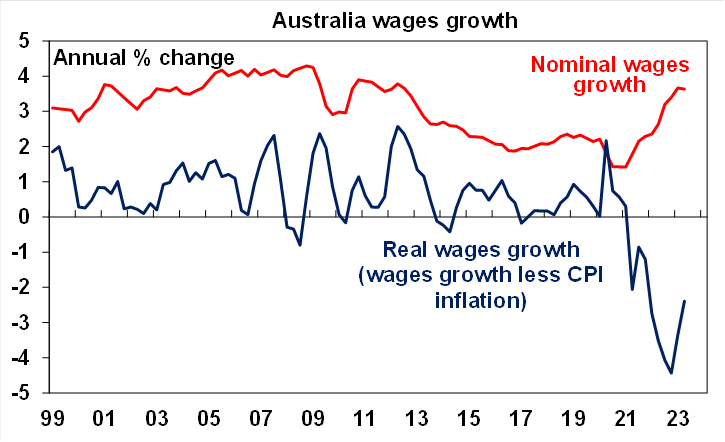
Wages growth also slowed in the June quarter but a pickup is likely in the current quarter. June quarter wages growth came in at a weaker than expected 0.8%qoq or 3.6%yoy. This was below market and RBA expectations for a 3.7%yoy rise and continues to show no sign of a wages breakout and of course in the meantime real wages are still falling (although this should start to reverse by mid next year). However, a greater proportion of those who got a pay rise in the quarter saw a 3% or more increase, the average rise in private sector wages for those who got a rise was 4.5% which is up from 3.8% a year ago and this year’s faster minimum and award wage increases will boost wages growth in the current quarter by around 0.3% more than was the case last year. So wages growth is still likely on its way to 4%yoy or just above – but this is in line with our own and RBA expectations.
Source: ABS, AMP
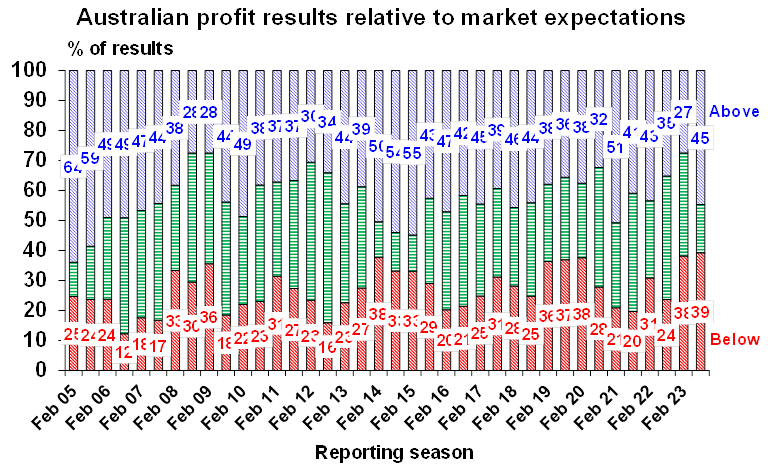
The Australian June half earnings reporting season is now about 40% done in terms of companies and 51% done in terms of market capitalisation. So far its been a bit better than expected but expectations are still getting revised down on the back of cautious corporate guidance. 45% of companies have surprised on the upside which is just above the norm of 43% and up on the February reporting season when it was just 27%. 54% of companies have seen earnings rise on a year ago which is similar to February, but this is down on the norm of 63%. And only 48% have increased their dividends on a year ago which is less than the norm of 58%, suggesting a degree of caution, and less companies than normal have seen their share price outperform the market on the day they reported. Of course, there is still a way to go yet and companies with good results have a tendency to report early. Key themes so far are that: cost pressures remain a challenge; building material companies are still benefitting from strong activity although there are expectations of a slowdown; insurers are seeing margin improvement (at the expense of their customers with big premium increases); so far home borrowers are keeping up their payments (but rate hikes have yet to fully flow through); and corporate guidance has been cautious with more negative than positive guidance and retailers in particular are warning of tougher conditions. Partly reflecting the cautious outlook guidance consensus earnings expectations have been revised down since the reporting season started. The consensus is now for a +1.8% rise in earnings for 2022-23 and for a -5.4% fall in earnings in 2023-24, with both revised down from +2.5% and -0.8% at the end of July.
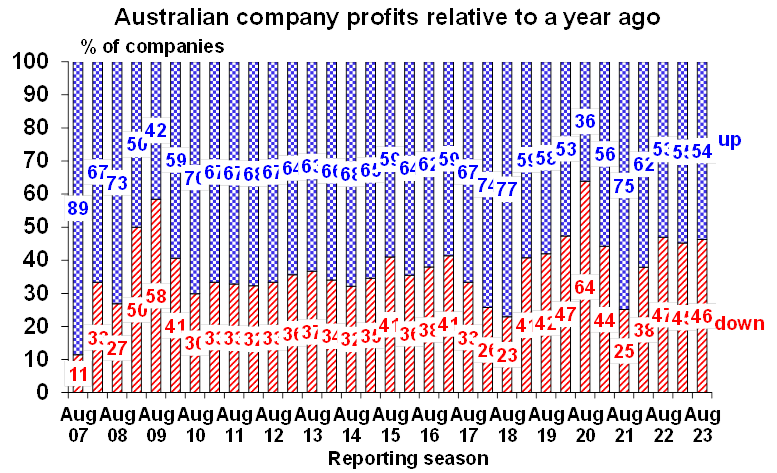
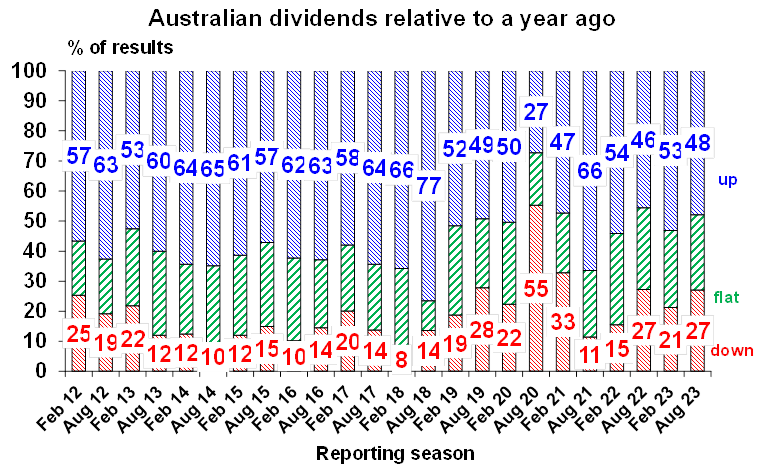
Source: AMP
What to watch over the next week?
August business conditions PMIs for the US, Europe, Japan and Australia will be released on Wednesday and will be watched to see whether the falls recorded in most countries recently continue or not.
In the US, the Fed’s annual Jackson Hole Symposium (Thursday to Saturday) will be watched for clues on the interest rate outlook with Fed Chair Powell scheduled to speak at it on Friday on the economic outlook. Given that the surge in bond yields represents a tightening in monetary conditions it’s hard to see Powell wanting to add to it by sounding too hawkish. On the data front July home sales data (Tuesday) is likely to trend softer not helped by the ongoing rise in mortgage rates and durable goods orders (Thursday) are likely to fall back after a strong rise in June.
On Monday, the Chinese central bank is likely to cut its key prime loan lending rates by another 0.15% or so.
The Australian June half profit reporting season will have its busiest week with around 110 ASX 200 companies reporting, including Ampol, Bluescope and IAG (Monday), BHP, Monadelphous, Scentre and Woodside (Tuesday), Domino’s, Woolworths and Worley (Wednesday) and South32, Stockland, Qantas and Wesfarmers (Thursday).
Outlook for investment markets
The next 12 months are likely to see a further easing in inflation pressures and central banks moving to get off the brakes. This should make for reasonable share market returns, provided any recession is mild. But for the next few months shares are at high risk of a correction given high recession and earnings risks, the risk of still more hikes from central banks, rising bond yields and poor seasonality out to September/October.
Bonds are likely to provide returns above running yields, as growth and inflation slow and central banks become dovish, but given the recent rebound in yields this may be delayed a few months.
Unlisted commercial property and infrastructure are expected to see soft returns, reflecting the lagged impact of the rise in bond yields on valuations. Commercial property returns are likely to be negative as “work from home” hits space demand as leases expire.
With an increasing supply shortfall, we revised up our national average home price forecast for this calendar year to around flat to up slightly ahead of 5% growth next year. However, the risk is high of a further leg down on the back of the impact of high interest rates and higher unemployment.
Cash and bank deposits are expected to provide returns of around 4%, reflecting the back up in interest rates.
The $A is at risk of more downside in the short term on the back of a less hawkish RBA and weak growth in China, but a rising trend is likely over the next 12 months, reflecting a downtrend in the overvalued $US and the Fed moving to cut rates.
What you need to know
While every care has been taken in the preparation of this article, neither National Mutual Funds Management Ltd (ABN 32 006 787 720, AFSL 234652) (NMFM), AMP Limited ABN 49 079 354 519 nor any other member of the AMP Group (AMP) makes any representations or warranties as to the accuracy or completeness of any statement in it including, without limitation, any forecasts. Past performance is not a reliable indicator of future performance. This document has been prepared for the purpose of providing general information, without taking account of any particular investor’s objectives, financial situation or needs. An investor should, before making any investment decisions, consider the appropriateness of the information in this document, and seek professional advice, having regard to the investor’s objectives, financial situation and needs. This article is solely for the use of the party to whom it is provided and must not be provided to any other person or entity without the express written consent AMP. This article is not intended for distribution or use in any jurisdiction where it would be contrary to applicable laws, regulations or directives and does not constitute a recommendation, offer, solicitation or invitation to invest.


